Page History: Volume Profile (VPR)
Compare Page Revisions
Page Revision: 2017/03/23 08:22
Is an overlay that gives a visual representation of how much volume occurs at each individual price over a certain period of time..

(VPR) Properties
To pull up the study property You can either right click anywhere in the chart window and select properties from the menu or click the Chart Properties button

Simply Left click on the Value column to configure VPR properties.

- Custom Label Left click in the value area to add your own unique name to the Study.
- Display Historical Profiles When enabled It will display a separate profile for each trading day. When disabled if will only display a profile for the current day.
- Anchor Side Left click in the value area to set the anchor side of the profile to be displayed on the left or Right.
- Proportional Width Changing the number in the value area will set the percentage of the chart width to use for the profile display.
- Opacity Left click in the value area to set the amount of Transparency in the underlay.
- Profile Display Left click in the value area to Choose how to display the profile bars. When you click in the value area you can choose set the bars to
Total Volume at Price
Bid/Offer breakdown (bid first)
Bid/Offer breakdown (offer first)
Percent of POC
- POC Profile Colors This is where you can set the color display of the bars. NOTE: This option will change based on the previous selection made in the Profile Display.
- Reverse POC Profile Enabling this will reverse the POC color. Note this option is only available If you select Percent of POC in the profile display.
- Display Value Area (VAVo) Whether to display the volume value area. Prices that cover 70% of the volume traded.
- VA Display How to display the value area. You can choose from
Indicator
Background
Bar Color
- Value Area Color Left click on the color bar to choose the color to use to indicate the value area.
- Display Point of Control(POCVo) When enabled it will display the volume point of control, Which is the price at which the most volume traded.
- POC Display Left click in the value area to choose how to display the point of control. You can choose from
Indicator
Background
Bar Color
- POC Color Left click on the color bar to choose the color to be used to indicate the point of control.
Quick demo of the Display of Historical Profiles
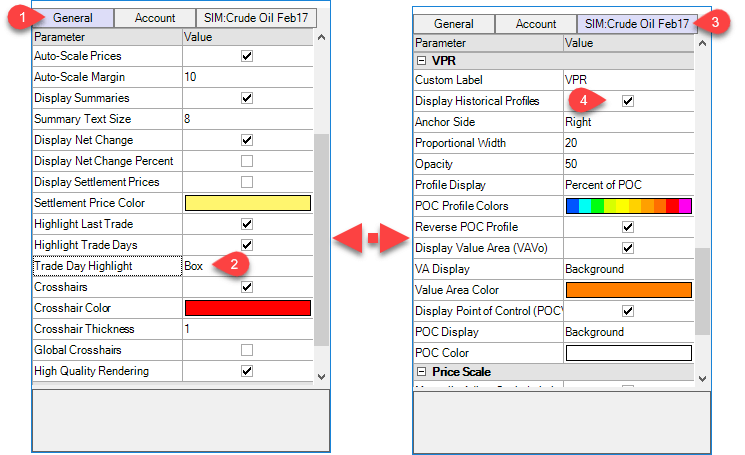
The volume profile study allows for much flexibility. In the image below the Volume Profile is displaying a separate Profile historically for each day as opposed to just the current trading day. As an added tip this demo will show you how to highlight the trading days with a box instead of shading.

To do this you need to pull up the study property You can either right click in the chart and select properties from the menu or click the Chart Properties button

- When you open the chart properties you can click on the General tab.
- Then left click in the value area and from there you can choose between background or Box. I have changed it to box so it will put a box around the trading days instead of shading it.
- Then I clicked on the Bar properties tab labled Sim Crude Oil Future and scrolled down to the VPR Study. To see how to add studies you can click link here to Add a study
- Finally you can left click in the value area to enable the Display Historical Profiles.
Important Tip: Historical volume profiles only work on intra-day (smaller than 1 day) intervals and not on Tick or Volume bars. This will be added in the future, or as demand for it dictates. You can email
[email protected] with any questions or feature requests.